
7月25日雅思小作文高分范文
题目:
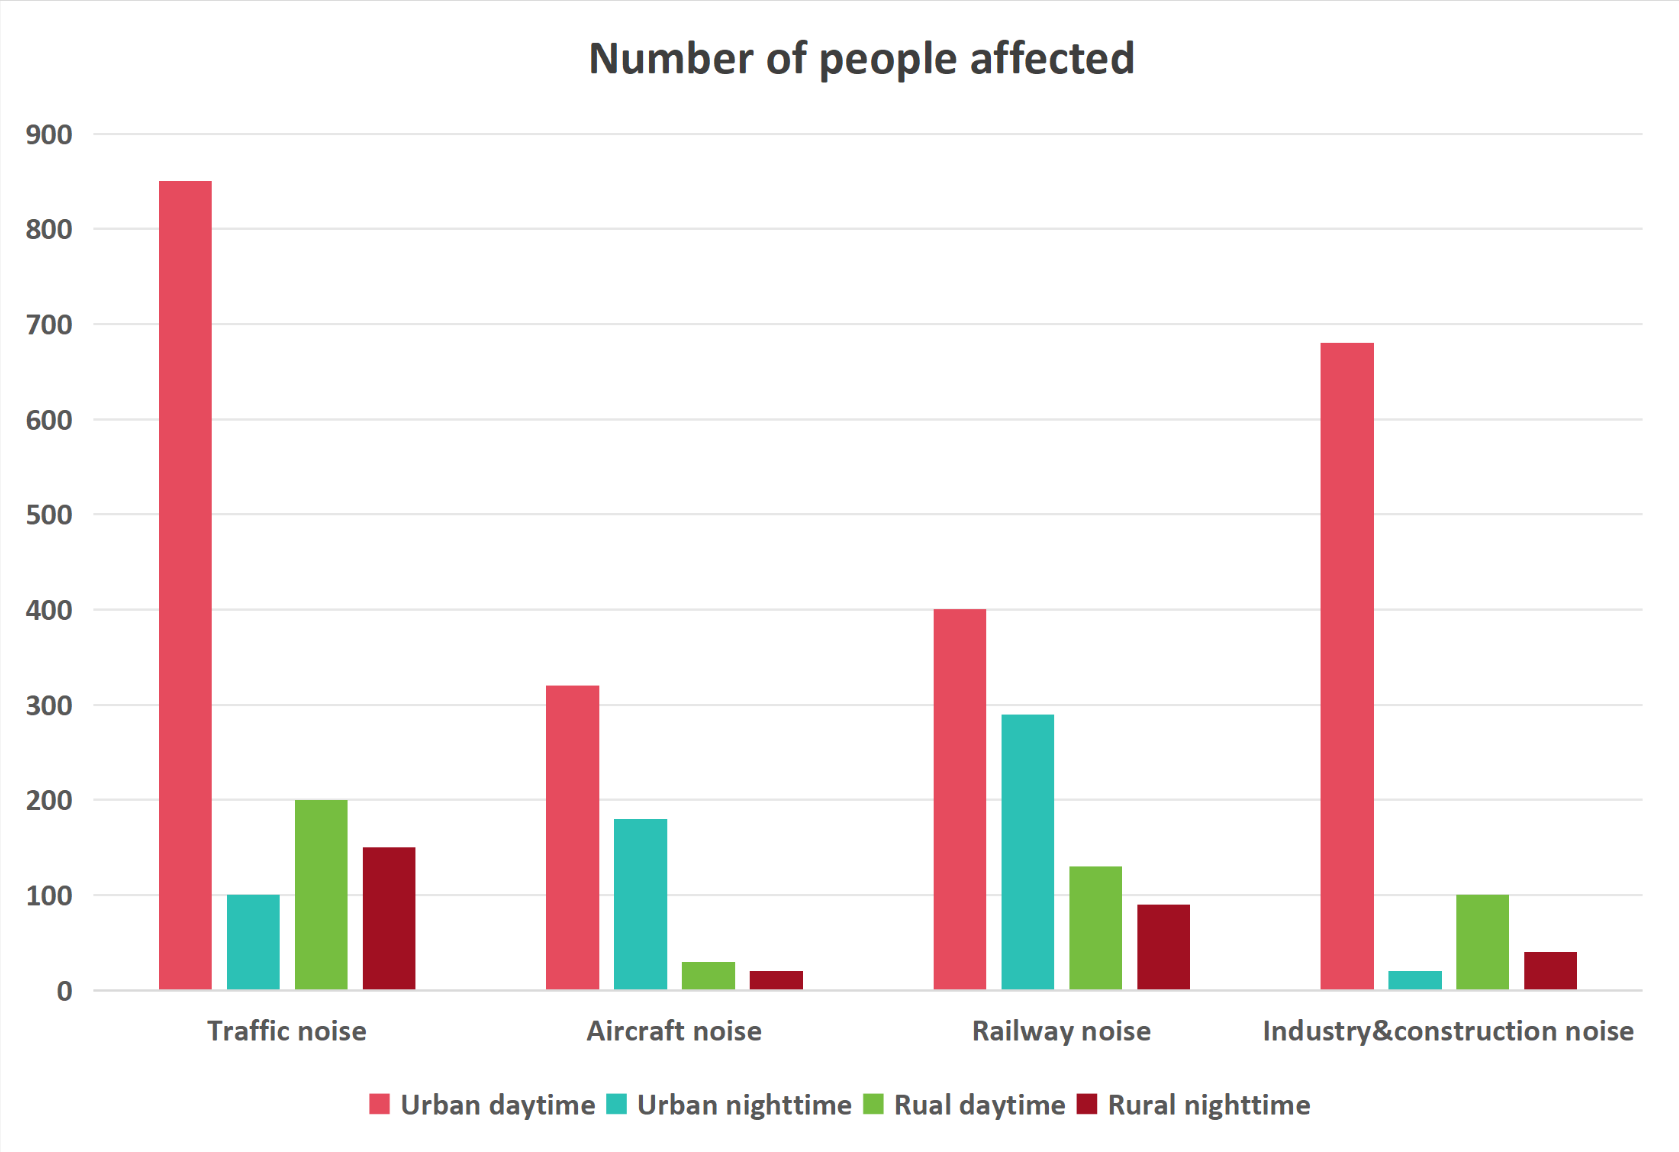
The chart below shows the number of residents affected by different types of noises during the day and night in urban and rural areas in a particular area of the UK in 2020.
范文:
The chart illustrates how many people in urban and rural areas of one UK region were affected by traffic, aircraft, railway, and industrial or construction noise during the day and night in 2020.
During the daytime, traffic was by far the most prevalent disturbance, affecting about 850 urban residents and approximately 200 people in rural communities. Industrial and construction noise ranked second in cities, at nearly 700, whereas the corresponding rural figure was only around 100. Railway noise affected roughly 400 urban residents and about 130 rural inhabitants. Aircraft produced the lowest rural daytime figure, at just around 30, compared with slightly over 300 in urban areas.
At night, railway noise became the leading problem in urban locations, disturbing almost 300 residents, followed by aircraft noise at approximately 180. By contrast, traffic affected only around 100 urban residents, while industrial and construction activity disturbed merely about 20. In rural areas, traffic remained the dominant source of nighttime noise, affecting roughly 150 people. The equivalent figures for railway, industrial and aircraft noise were considerably lower, at approximately 90, 40 and 20 respectively.
Overall, daytime noise affected more residents than nighttime noise in every category. Urban figures were also generally higher than their rural equivalents, although rural residents were more widely affected by traffic and industrial noise at night.
7月18日雅思小作文高分范文
题目:
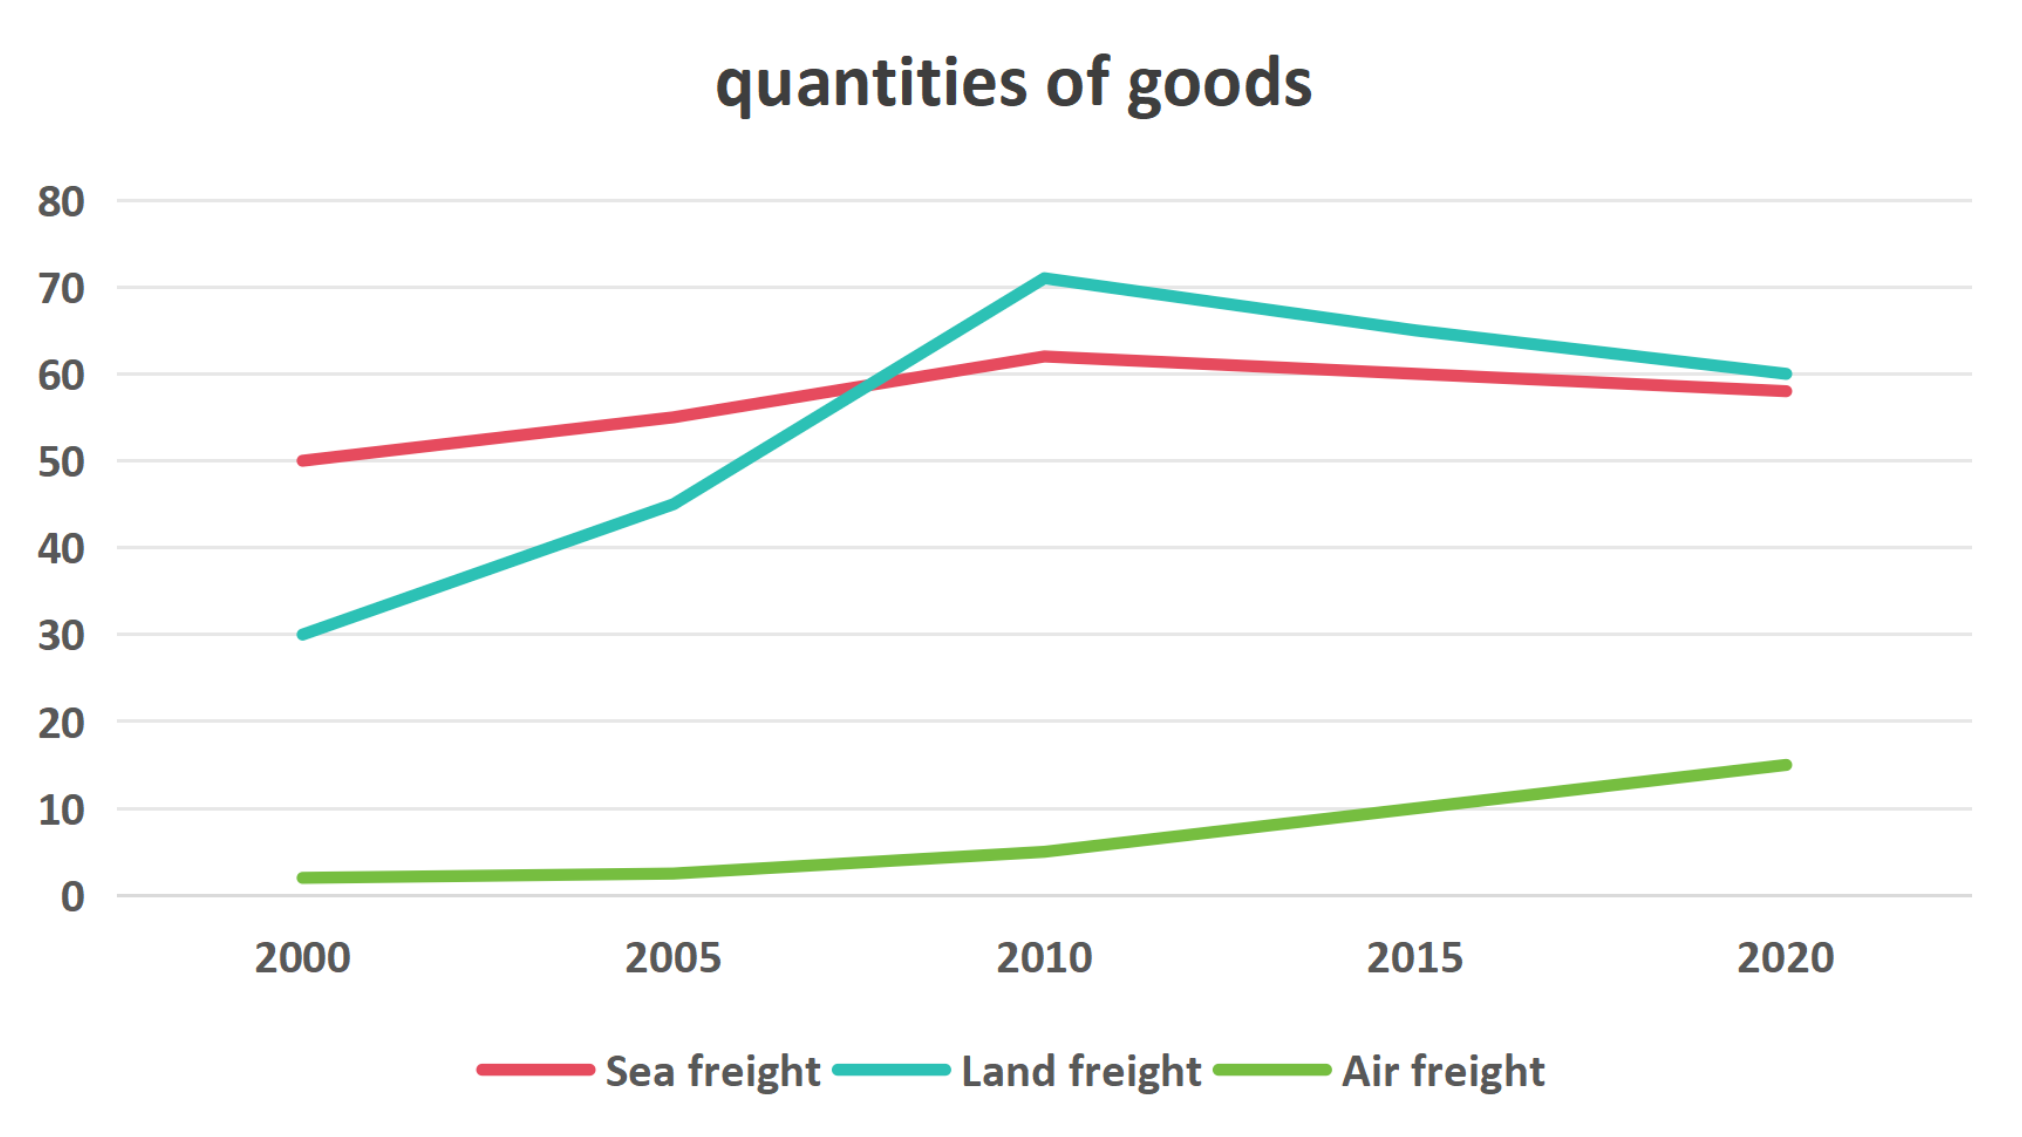
The graph below shows the weight (in million tons) of products transported by three kinds of ways in the UK from 2000 to 2020.
范文:
The line graph compares the quantity of cargo, measured in millions of tons, distributed across the UK using three distinct transport methods—sea, land, and air—between 2000 and 2020.
In 2000, sea freight was the dominant mode of transport, accounting for 50 million tons of transported goods. It climbed steadily to reach a peak of 62 million tons in 2010, followed by a minor drop to 60 million tons by 2015, a level it maintained until 2020. Conversely, land freight began at a much lower point of 30 million tons. However, it grew dramatically over the next decade, soaring to a peak of 71 million tons in 2010 and surpassing sea freight as the most utilized method. This peak was not sustained, as land cargo steadily fell to 65 million tons in 2015 and ultimately finished at 58 million tons in 2020, just below sea freight.
In stark contrast, air freight handled a negligible amount of cargo at the beginning of the period, standing at just 2 million tons in 2000. It experienced minimal growth over the next five years, rising to 2.5 million tons in 2005. Over the subsequent 10 years, however, the growth accelerated, doubling from 5 million tons to 10 million tons by 2015, and finally reaching a peak of 15 million tons in 2020.
Overall, the total volume of transported goods increased across all three sectors over the 20-year timeframe. While land and sea freight consistently dominated UK logistics, air freight remained a minor transport method despite experiencing a significant upward trajectory towards the end of the period.
7月11日雅思小作文高分范文
题目:
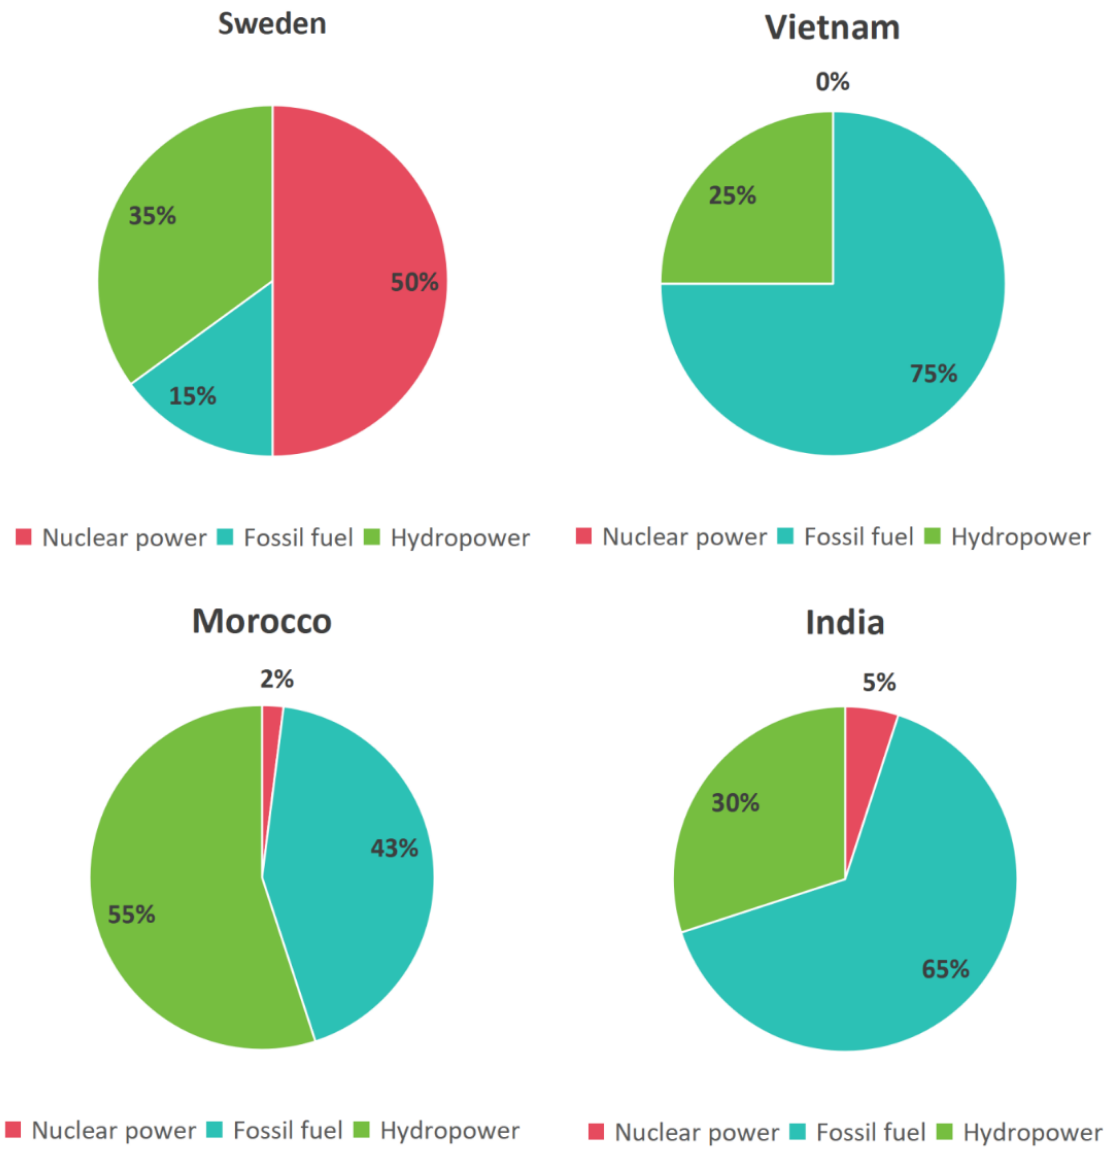
The charts below show the percentages of electricity produced from different sources in four countries in 2008.
范文:
The provided pie charts illustrate the percentage distribution of electricity generated from nuclear power, fossil fuels, and hydropower in four nations—Sweden, Vietnam, Morocco, and India—in 2008.
Fossil fuels played a commanding role in the energy profiles of India and Vietnam, accounting for 65% and 75% of their total electricity production, respectively. In contrast, this resource was far less significant in Morocco and Sweden, where it contributed 43% and a mere 15% to their respective national grids.
Regarding nuclear power, Sweden was the only country to utilize this source substantially, with exactly half (50%) of its electricity originating from nuclear plants. In comparison, nuclear energy was virtually non-existent in the other three nations, making up a negligible 5% in India, 2% in Morocco, and a clean 0% in Vietnam.
Hydropower served as a major secondary or primary source across all four countries. It was the leading source of electricity in Morocco, accounting for the largest share at 55%. Sweden also generated a significant portion of its electricity from water, at 35%. Meanwhile, India and Vietnam exhibited similar reliance on hydropower, which yielded 30% and 25% of their total electricity production, respectively.
Overall, fossil fuels were the predominant source of electricity in India and Vietnam, whereas Morocco was primarily dependent on hydropower. Sweden exhibited a contrasting pattern, relying chiefly on nuclear energy to fulfill its electricity needs.
如果需要全部内容请查看下方资料领取方式。
雅思小作文资料免费领取方式
添加马甲微信,发送暗号「雅思小作文」给小马甲即可无条件领取资料哦!(注:已有小马甲微信,无需重复添加哦~)